In this series of images with annotations, Newark residents reflect on the streets and places where they grew up, in buildings that are now demolished. Each comment corresponds to the image of that person’s demolished childhood home.
From 1949 to 1967, government agencies and universities spent hundreds of millions of dollars to demolish so-called “slums” and to rebuild Newark. In the process, at least 10,000 historic buildings on 2,500 acres were demolished and 50,000 people were displaced, 65% of whom were Black and Hispanic. Newark undertook more urban renewal spending per capita than any of the nation’s thirty major cities. Neighborhood clearance for interstate highways and the campuses of Rutgers University, the Newark College of Engineering, and the University of Medicine and Dentistry contributed to the July 1967 uprising. Thousands of Blacks, who saw their neighborhoods, families, and businesses displaced by powerful institutions, rose up. In the resulting battles between protestors, Newark police, and national guards, 727 were injured and 26 died.
Long-term patterns of White flight, urban decay, and under investment accelerated after the 1967 unrest. From 1960 to 1990, 130,000 fled Newark, leaving abandoned neighborhoods behind them. Urban renewal started displacement, but White flight and urban decay continued it. The extent of neighborhood demolition expanded from urban renewal areas into surrounding neighborhoods, rich with hundreds of historic structures but no communities left to preserve them. In addition, Blacks from displaced “slum” clearance projects moved into neighboring White neighborhoods like Vailsburg, Weequahic, and Irvington, in turn causing White flight from those communities. Demolition continues today of the precious little architectural and historic fabric that survives of lost Newark. Most of the neighborhoods that are parking lots and empty lots today were destroyed after, not before, the 1967 unrest.
Through photos, this digital exhibit documents the impacts of urban renewal, White flight, and abandonment on Newark neighborhoods. From 1959 to 1968, Samuel Berg MD documented Newark’s built environment in 2,400 photographs of street scenes, old houses, small businesses, factories, churches, schools, and public spaces. His photos are a unique document of Newark’s rich and varied built environment before demolition. In 2018, the Newark Public Library completed the digitization and tagging of these photos. In 2022, the photo collections were georeferenced to their contemporary locations on Google street view, so as to empower the comparison of change over time.
“The University has never demolished any historic building or any neighborhood of any historic value. Name one.”
. – Joel Bloom
Former president of the New Jersey Institute of Technology in a December 2020 community meeting with residents of the James Street Commons historic district
The majority of Dr. Berg’s photos document the 2.5 square mile area of Newark bounded by Interstate 280 to the north, Bergen Street to the west, Clinton Avenue to the south, and the Passaic River / Route 21 to the east. In the period 1950 to 2020, over 90% of all homes were cleared in this area home to almost 100,000 people in the 1940s. Roseville lost to build Interstate 78 and Weequahic lost to build Interstate 280 were also documented. Only a few of his photos document other neighborhoods. See map:
‣ Click icons for thumbnail images.
‣ Click thumbnails for photo comparison with contemporary Google street view.
‣ Thumbnails launch photo comparison on new page.
Travelers' Map is loading... If you see this after your page is loaded completely, leafletJS files are missing.
Map color key accurate as of summer 2026.
Map will be updated as the city continues changing.
‣ Click icons for thumbnail images.
‣ Click thumbnails for photo comparison with contemporary Google street view.
‣ Thumbnails launch photo comparison on new page.
Travelers' Map is loading... If you see this after your page is loaded completely, leafletJS files are missing.
Map color key accurate as of summer 2026.
Map will be updated as the city continues changing.
‣ Click icons for thumbnail images.
‣ Click thumbnails for photo comparison with contemporary Google street view.
‣ Thumbnails launch photo comparison on new page.
Travelers' Map is loading... If you see this after your page is loaded completely, leafletJS files are missing.
Map color key accurate as of summer 2026.
Map will be updated as the city continues changing.
Travelers' Map is loading... If you see this after your page is loaded completely, leafletJS files are missing.
Dan O’Flaherty remembers the experience of growing up in Roseville and being able to walk wherever he needed – to school, to church, and to the park:
“Without crossing any streets I could walk to school, to two doctors, to a dentist, to a bar, and to a candy store named Ratner’s that sold egg creams. There was also H&B, a grocery store, on the same block as Ratner’s. If we were Presbyterian, we could go to church, too.
Travelers' Map is loading... If you see this after your page is loaded completely, leafletJS files are missing.
Map of the neighborhood cleared to build the UMNDJ campus. As the first step in preparation for urban renewal, this survey map was created in 1960 of all property owners, property values, and property lines. Based on this map, the extent of the urban renewal area was determined and communicated to demolition crews.
4,464 people displaced in 1961
representing 925 families
705 of color (76%)
220 White (24%)
Plus an additional 3,163 people after the 1967 rebellion, creating a total of 7,627 people displaced
$26,291,000 in federal funds and
$7,408,000 in city funds
cleared 141.7 acres.
Map of the neighborhood cleared to build the campuses of Rutgers (left) and the New Jersey Institute of Technology (right). As the first step in preparation for urban renewal, this survey map was created in 1959 of all property owners, property values, and property lines. Based on this map, the extent of the urban renewal area was determined and communicated to demolition crews.
By the numbers:
2,658 people displaced
representing 912 families
599 of color (66%)
313 White (34%)
$7,838,000 in federal funds and
$3,499,000 in city funds
cleared 57 acres from 1963 to 1974.
From Harland Bartholomew’s 1913 master plan. So thorough was de-industrialization in Newark that not one factory dot from this image survives a century later, source.
This is New Jersey’s greatest concentration of polish and finance. It’s worn and blighted. But we have the spirit and vigor to grow and build anew as here in the new campuses of Rutgers University and the Newark College of Engineering. In time they will accommodate 25,000 students making Newark a college town. Newark has undertaken more urban renewal per capita than any other of the nation’s 30 major cities. In our time, one-fifth of our city will have been rebuilt with projects like these.
– 1966 newsreel on urban renewal efforts
Newark’s declining industrial economy:
During the past century, Newark lost the economic foundation it once had of factories, heavy industries, and easy-to-find employment on the factory floor. Detroit’s economy was shaped by the three largest employers – General Motors, Chrysler, and Ford – along with hundreds of other smaller industries that supplied parts and materials to the auto assembly lines. Newark’s industrial base, in contrast to an auto city like Detroit, a camera city like Rochester, and a fabric city like Lowell, was always more varied and more diverse in its number and variety of small manufacturers. However, no diversity of manufacturing enterprises excused any northeastern city from the aftershocks of industrial decline.
Economic growth follows a similar pattern on the local, national, and international scales. Manufacturing mostly happens in developing countries, where labor is cheap and raw materials are abundant. Meanwhile, more developed countries engage in new industries in the service sector, such as insurance, banking, and white-collar work in corporate America. This shift from industrial to service sector effected Newark and just about every American city of any size. There are winners like San Francisco now home to high-tech industries. And there are losers like Detroit that has not found (and will likely never find) a new industry that will give the city as much prosperity and wealth as the auto industry. Manufacturing jobs were the lever of social mobility for the working classes to migrate up into the middle classes. America’s shrinking manufacturing jobs mirror a shrinking middle class.
After WWII, there was a brief moment when it seemed Newark’s manufacturing base would survive. It was a moment when it seemed distant suburbs could grow and surround Newark without siphoning off people, energy, and employment from Newark. And yet, by the late 1950s, city leaders saw the city losing both people and its industrial base. Decades of technological progress had made factories larger, transportation cheaper, and mechanization easier. Factories needed fewer laborers to make more products, and hence there was less reason for factories to remain in cities like Newark. Taxes were higher, transportation was more expensive, and there was no need to remain within walking distance of the neighborhoods and immigrant enclaves where cheap immigrant laborers once lived.
In the 1910s, over 50% of Newark’s jobs were found in manufacturing and industries that served manufacturing. By 1912, there were 2,000 factories employing 76,000, producing goods worth $220 million. By the 1960s, this had fallen to less than 30%. And today, it is less than 5%. In the 1950s, Newark’s city leaders were worried with the trends they saw: declining industrial employment, rising unemployment, aging infrastructure and city services, declining tax revenue, and a population flight of wealth and middle-class people to the suburbs. Those left behind in Newark were the unemployed, the urban poor, Blacks, and a small but soon-to-grow number of immigrants from the Caribbean and Latin America. (Latin Americans and Mexicans only started arriving in northeastern cities after 1965 changes to immigration law.) Newark needed industrial employment, but it did not have the land in the centuries-old urban core for growing factories. Newark needed to attract and grow service sector jobs in insurance, banking, and higher education, but it did not have the financial resources to retain these employers downtown.
The truly dynamic American cities are those that are coming to grips with the problem of outmoded structures. Increasingly we are seeing large-scale demolition as the first step in building modern cities. the need of the hour is to acquire plottage by merging narrow lots for a new start. Getting needed space in our cities for modern structures is the only way to meet the competitive force of growing suburban strength.
– 1950s film from the U.S. Chamber of Commerce
Newark’s response to decline through a program of urban renewal:
In response, not just in Newark but nationwide, a program of urban renewal was introduced. University structures in Brutalist concrete replaced the homes of thousands of people. Newark’s new employment base would become the university. Industrial production would become knowledge production. In some ways, this dream became a reality. Newark is now the state’s largest college town with the campuses of Rutgers, Rutgers Medical School, Seton Hall, Essex County College, and the New Jersey Institute of Technology. Together these universities host 25,000 mostly middle-class students on land where 25,000 mostly-Black and working-class residents once lived. A more desirable social class has replaced a less desirable one. In other ways, the vision of urban renewal failed. Plans for the college campus replaced walkable, historical, and visually exciting streetscapes with hundreds of acres of surface parking and college campuses that face away from the street and city. All of Newark’s universities are commuter schools, where the majority of students and faculty live outside Newark. Newark has 200,000 jobs. Nearly half these jobs offer middle-class salaries upwards of $50,000. And yet, the majority of people who work in these schools live outside Newark. Wealth generated in Newark does not stay in Newark.
Dr. Berg’s photos show what the campuses of Newark’s universities looked like before clearance for urban renewal. These were mostly Black and multiracially integrated neighborhoods wiped clean from the map. City leaders reasoned that public housing, residential areas, and homes should not be near downtown. Mid-century planners used land use zoning to separate commercial and residential areas, to produce the mono-culture neighborhoods we see today that are all residential (and inactive on workdays) or all commercial (and inactive outside working hours). The White Downtown should be a commercial and commuter area. Downtown should be linked to the all-White suburbs by highways, and it should be separated from the nearby “Negro” neighborhoods by a belt of public housing and university campuses. Indeed, Downtown Newark is now surrounded to its west by the campuses of Rutgers and the New Jersey Institute of Technology. Blight and Black were to be buffered from the wealth of Downtown by the university. Educational institutions were transformed into tools of slum clearance and the city’s economic re-orientation.
Recommended Predominant Land Use in 1955
Notice the brown arrows around perimeter of map pointing toward areas for constructing “new housing.” This table of urban renewal projects indicates that areas where housing was demolished and not replaced were concentrated in downtown. Areas where more housing was added than demolished were located closer to the city edge. This illustrates the drive toward population decentralization. (Source)
As you view these photos, consider: What can the university do to repair the damage it did in the 1960s to thousands of Blacks in dozens of neighborhoods? How can the redesign of its campuses better integrate into the urban streetscape and begin to rebuild the quality of urban form that was lost to urban renewal? If the built environment is to be a tool for social equity, then the university must be the place to start. Efforts over the past decade from Rutgers at its Living Learning Center and NJIT at its new dorms on Warren Street continue to transform these schools into anchor institutions and 24/7 campuses active in the city and in neighborhood life. Rutgers has come a long way in its urban polices, in its diversity of faculty and students, in its campus design, and in its urban focus since its 1960s origins as an agent of slum clearance.
Historic brownstones on High Street
And the same scene in 1964 showing all buildings raised for urban renewal
Urban historian Arnold Hirsch on the legacy of urban renewal and public housing in Newark:
.
Urban renewal “legislation defeated even the best intentions of public-spirited officials who took the mandate to clear slums seriously. In Newark, the local housing authority tried to replace crumbling tenements with decent housing. Clearance in poor black areas, however, merely left the Newark Housing Authority (NHA) in possession of considerable vacant land – private developers were not eager to invest in such areas. To make renewal work, the NHA discovered it had to jettison its original goals and become more “flexible” in dealing with private business. Rather than “peddling vacant land,” the NHA decided, in the words of one official, to “let the redevelopers tell us where they want to build.” “Choice sites” and standard structures subsequently fell before the wrecker’s ball, luxury apartments went up near the central business district, and much of the unmarketable vacant land in black areas was, for lack of suitable alternatives, devoted to public housing. As in Chicago, the ghetto was reinforced by new government-sponsored projects with indeterminate life-spans. Subsidies and profits flowed, as the business creed ordained, to the developers.
Arnold Hirsch. “Epilogue.” In Making the Second Ghetto: Race & Housing in Chicago 1940-1960. University of Chicago Press, 1983. Pp. 274-75.
The highway and automobile were two of the largest factors driving Newark’s 20th century decline in economic and political power.
For most of Newark history, the majority of population growth and economic energy were confined within the city limits. In 1910, Newark’s population of 347,000 was concentrated in Downtown and immediately adjacent neighborhoods. Within two miles of Downtown, large parts of the city remained farmland beyond the reach of commuter trolleys, pedestrians, and horse carriages. What is now Port Newark and Newark Airport were only salt marshes. Almost none of the South Ward and little of the North Ward were developed. The West Ward was a suburb most easily accessible to downtown by trolley.
Over a century, Newark – as well as just about every American town and city – witnessed massive population loss. At the same time, the city edge was developed from farmland into endless rows of suburbs. The automobile and highway made this transition from a high-density into a low-density city not only possible, but inevitable. No part of Newark is now untouched by urban sprawl. Newark’s population of 281,000 in 2020 represents fewer people spread out over a larger surface area than in 1910.
The Interstate Highway Act of 1956 offered funding to state and city governments for highway construction. This law changed the face of American cities. Federal funding covered up to 90% of land clearance and construction costs. In the web of highways that resulted, two major interstates sliced through Newark: Route 280 was carved through the Central and North Wards c.1960 while Route 78 was carved south through the Weequahic neighborhood c.1963. To clear the land for the path of both highways, at least 5,000 Newark residents were displaced, hundreds of small businesses were closed, and hundreds more homes were demolished.
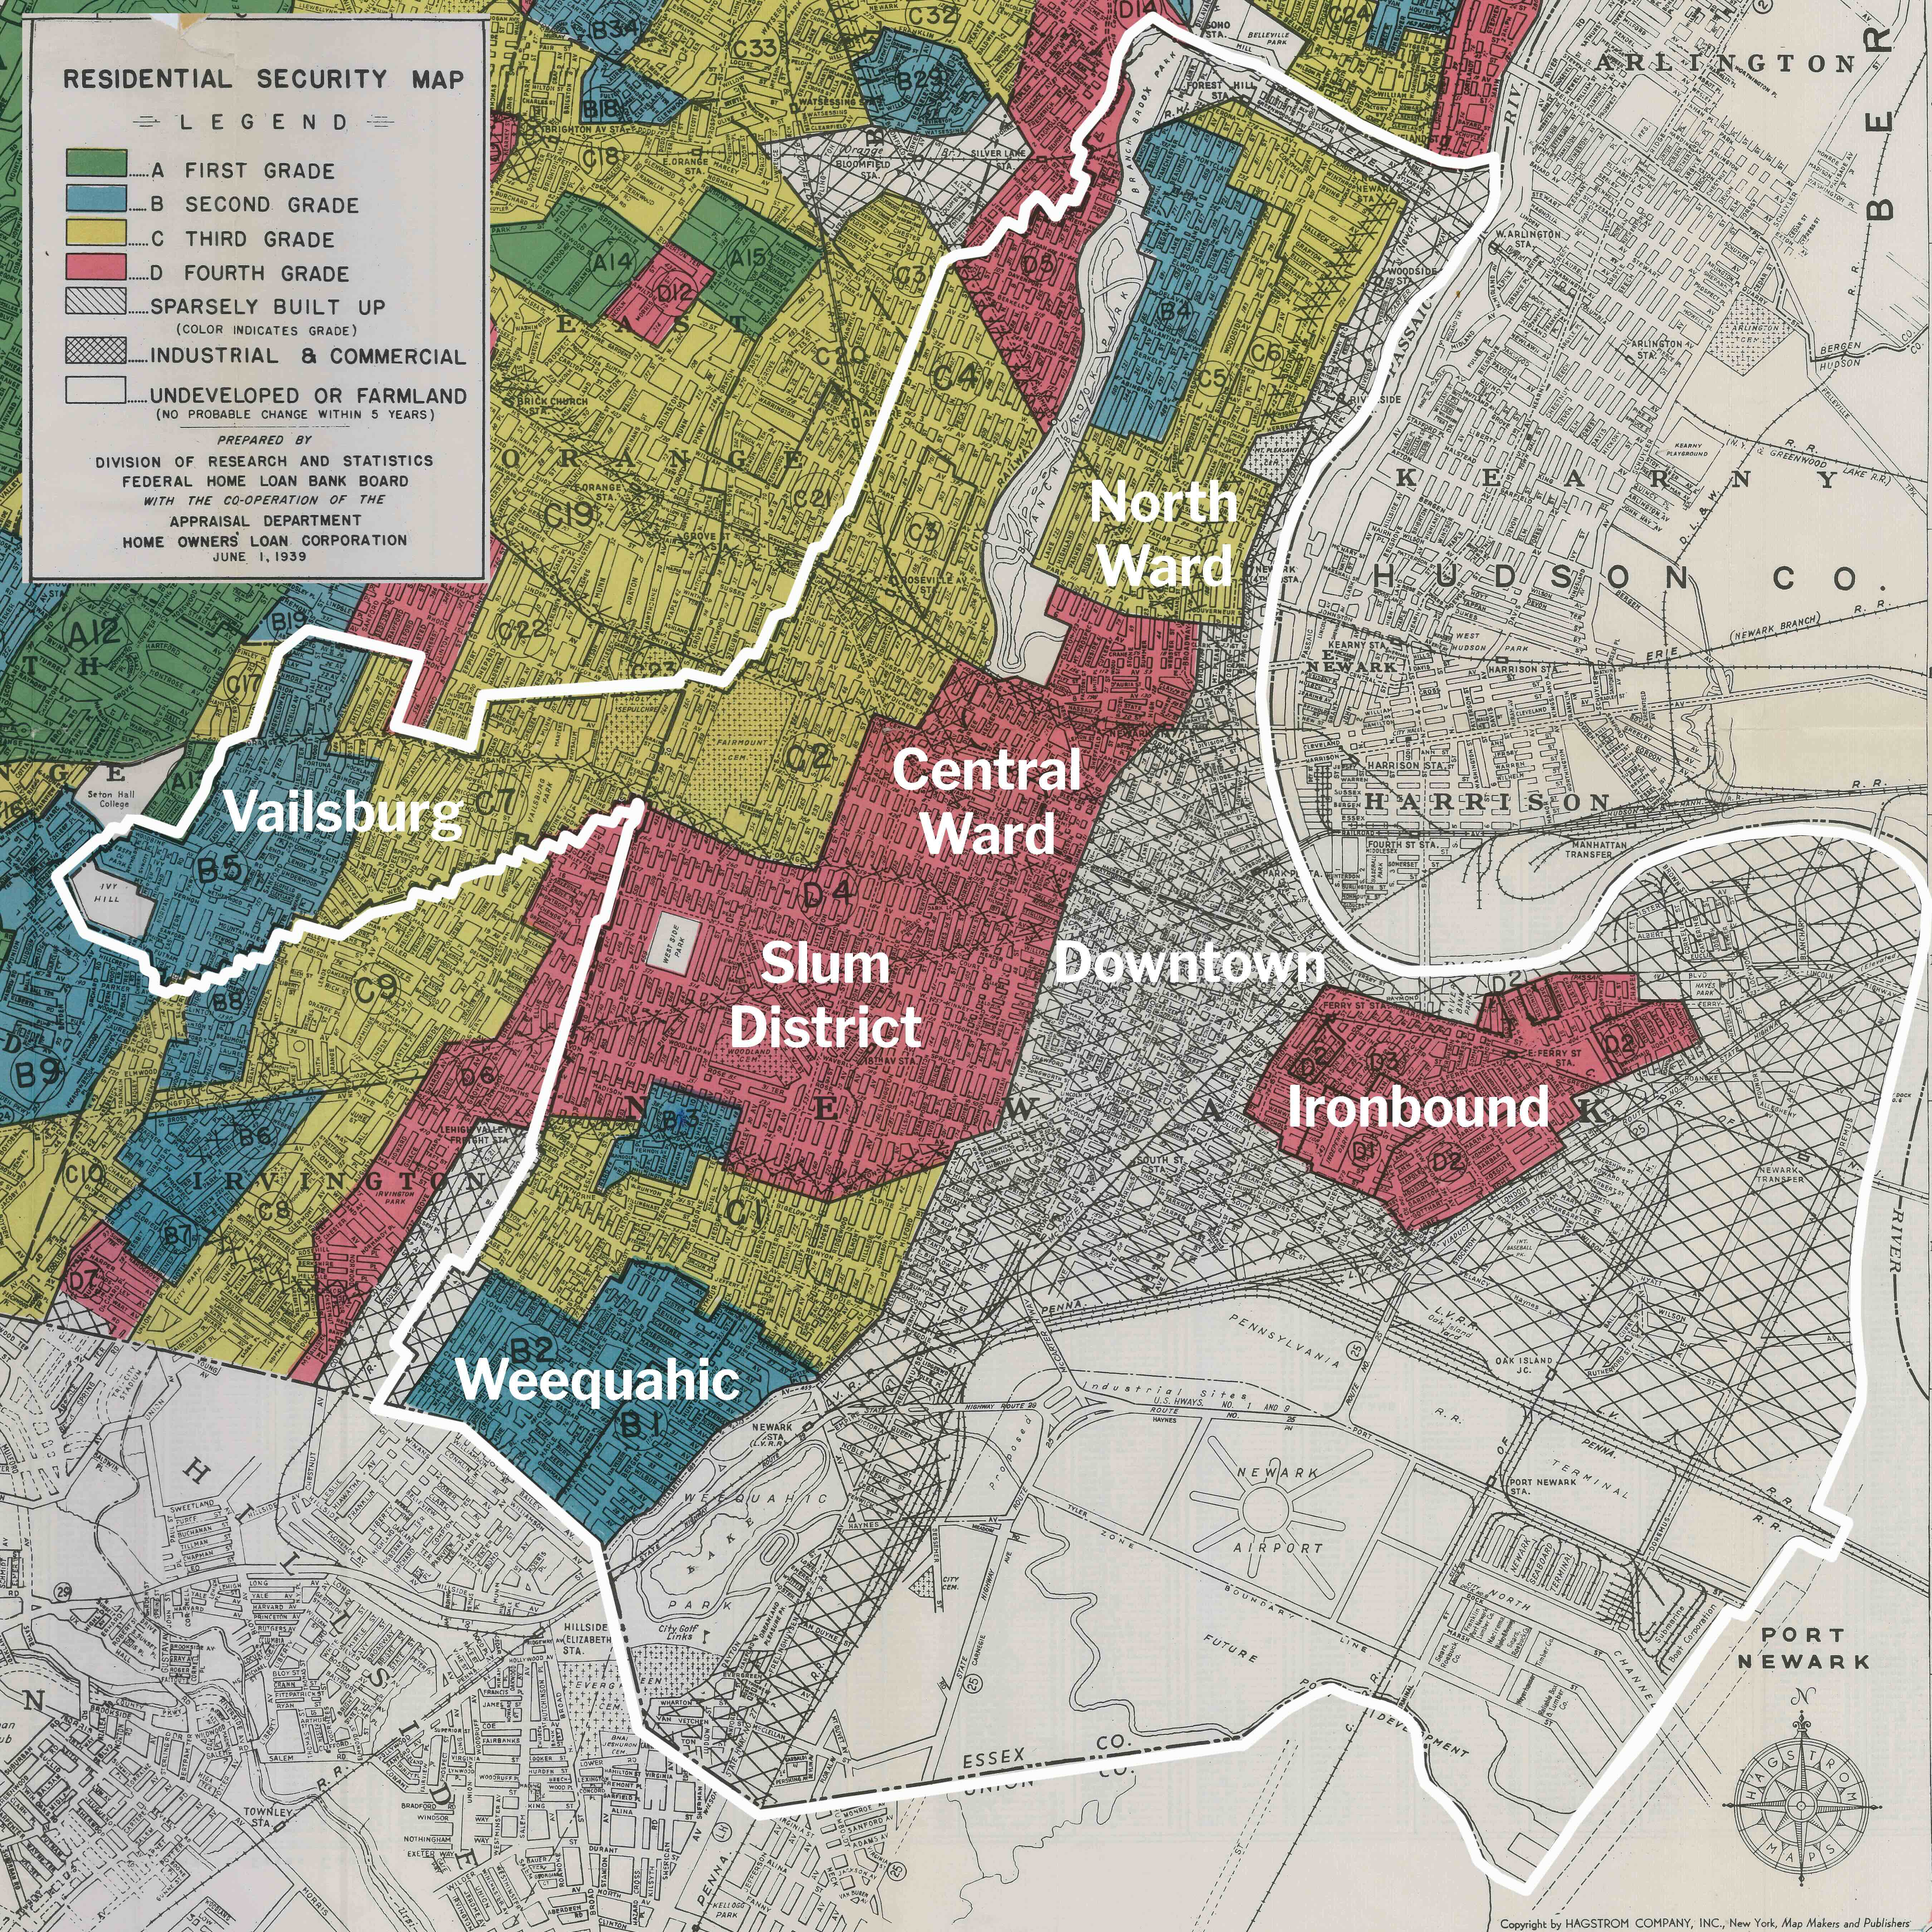
For centuries, Blacks were locked out of owning their own land and homes. For the first time, migration to northern cities like Newark opened up the chance for them to own their own homes. While redlining practices from banks denied mortgages to many of them, growing numbers slipped through and bought their own homes. And yet, urban renewal and highway construction were erasing much of the progress these Black communities were making toward equal rights. For every one new Black resident to settle in Newark, two White residents left the city. Newark was losing population, at first slowly in the 1950s and then at an unstoppable pace by the 1970s.
Newly opened interstate highways displaced Black and non-White peoples from destroyed urban communities, while empowering White residents to flee the city for the suburbs. For the first time in Newark history, highways ensured that areas twenty or thirty miles distant from the city remained within commuting distance of White-collar jobs downtown. The result of highway construction was both population loss in the city center and a growing physical divide between Black and White communities. While the average Newark Black resident in 1960 was less than a mile distant from the nearest White neighborhood, by the 2000s Newark’s Blacks were separated from Whites by several miles. New Jersey remains racially and spatially divided. While highways were not the only factor responsible, their construction through Newark accelerated the already-present racial divisions.
With limited funding and competing special interests, the City of Newark had to choose between building more highways or building more affordable housing. The choice was made to build more highways instead of, and at the cost of, building more housing. City leaders and corporate interests argued that highways would clear away slums, would allow suburban residents to bypass slum areas, and then find easy parking downtown. It was more important to build highways and parking lots than housing and neighborhoods in downtown Newark. As Harold Kaplan described in his 1963 book Urban Renewal Politics:
In recent years, they had come to the conclusion that Newark’s future economic health depended upon a revitalization of its central business district. While sites should be cleared for new firms, the immediate emphasis should be on increased access for suburban shoppers to and from the business district. What Newark needed was a network of elevated highways emanating in radial spokes from the business district to carry the suburbanites quickly and safely over the slums. The City should clear sites for downtown parking lots, not for more tax-exempt public housing projects that use up good commercial real estate and seal off the central business district.
Samuel Berg documented almost every single building demolished for the path of Interstate 78 and 280. His photos show entire neighborhoods in the years 1959 to 1961, just months before they were declared “blighted” and cleared of all residents. And yet, his photos encourage us to be critical of when developers and governments call a neighborhood “blighted” and a “slum.” Not one abandoned building appears in his hundreds of photos of these neighborhoods. At the same time, the pedestrians and residents who appear in Berg’s photos are almost all Black. It was not the condition of these homes and the quality of their construction that led the state to call these areas “blighted.” It was the color of their skin coupled with the convenience of building a highway through neighborhoods where residents were too powerless and too poor to resist.
Highways destroyed more than homes along their paths. They also lowered the quality of life in nearby neighborhoods. Weequahic is now cut off from the rest of the city by Interstate 78’s fourteen lanes of asphalt. Newark residents suffer from elevated levels of asthma and air pollution from vehicles, elevated temperatures from higher amounts of paved surfaces, and elevated noise pollution from congestion.
The built environment must be a tool for social equity. Any program of reparations must consider how to erase the decades of damage – environmental, economic, and social – that these highways have caused to generations of Newark residents.
At a cost of $40 million, 469 structures were demolished to displace 4,600 people in Newark’s Little Italy of the Old First Ward. This panoramic photos shows the extent of demolition by December 1, 1953. Caption: “First Ward area takes on tornado-tossed appearance as demolition proceeds. View south from 8th avenue with High street at left.”
Italo Calvino describes the city of Maurilia in his 1972 novel Invisible Cities. The book is a collection of paragraph-length descriptions of 55 imaginary cities drawn from across space and time. Here is one chapter, with each mention of Maurilia replaced with Newark.
In [Newark], the traveler is invited to visit the city and, at the same time, to examine some old postcards that show it as it used to be: the same identical square with a hen in the place of the bus station, a bandstand in the place of the overpass, two young ladies with white parasols in the place of the munitions factory. If the traveler does not wish to disappoint the inhabitants, he must praise the postcard city and prefer it to the present one, though he must be careful to contain his regret at the changes within definite limits; admitting that the magnificence and prosperity of the metropolis [Newark], when compared to the old, provincial [Newark], cannot compensate for a certain lost grace, which, however, can be appreciated only now in the old postcards, whereas before, when that provincial [Newark] was before one’s eyes, one saw absolutely nothing graceful and would see it even less today, if [Newark] had remained unchanged; and in any case the metropolis has the added attraction that, through what it has become, one can look back with nostalgia at what it was.
Beware of saying to them that sometimes different cities follow one another on the same site and under the same name, born and dying without knowing one another, without communication among themselves. At time even the names of the inhabitants remain the same, and their voices’ accent, and also the features of the faces; but the gods who live beneath names and above places have gone off without a word and outsiders have settled in their place. It is pointless to ask whether the new ones are better or worse than the old, since there is no connection between them, just as the old post cards do not depict [Newark] as it was, but a different city which, by chance, was called [Newark], like this one.
The flowering of the American city was short and came to a quick end. America was never an urban nation, at least it did not think of itself as urban for most of its history. But for a brief few decades between the end of the U.S. Civil War and end of the First World War, the American downtown prospered. Department stores, factories, banks, insurance companies, and the homes of wealthy and poor people alike were all clustered around the American downtown. Downtown was the center, first of people, then of industry, and then of the cultural institutions built by public funds and industrialists’ donated wealth: public libraries, public museums, and public parks.
1913 map by Harland Bartholomew
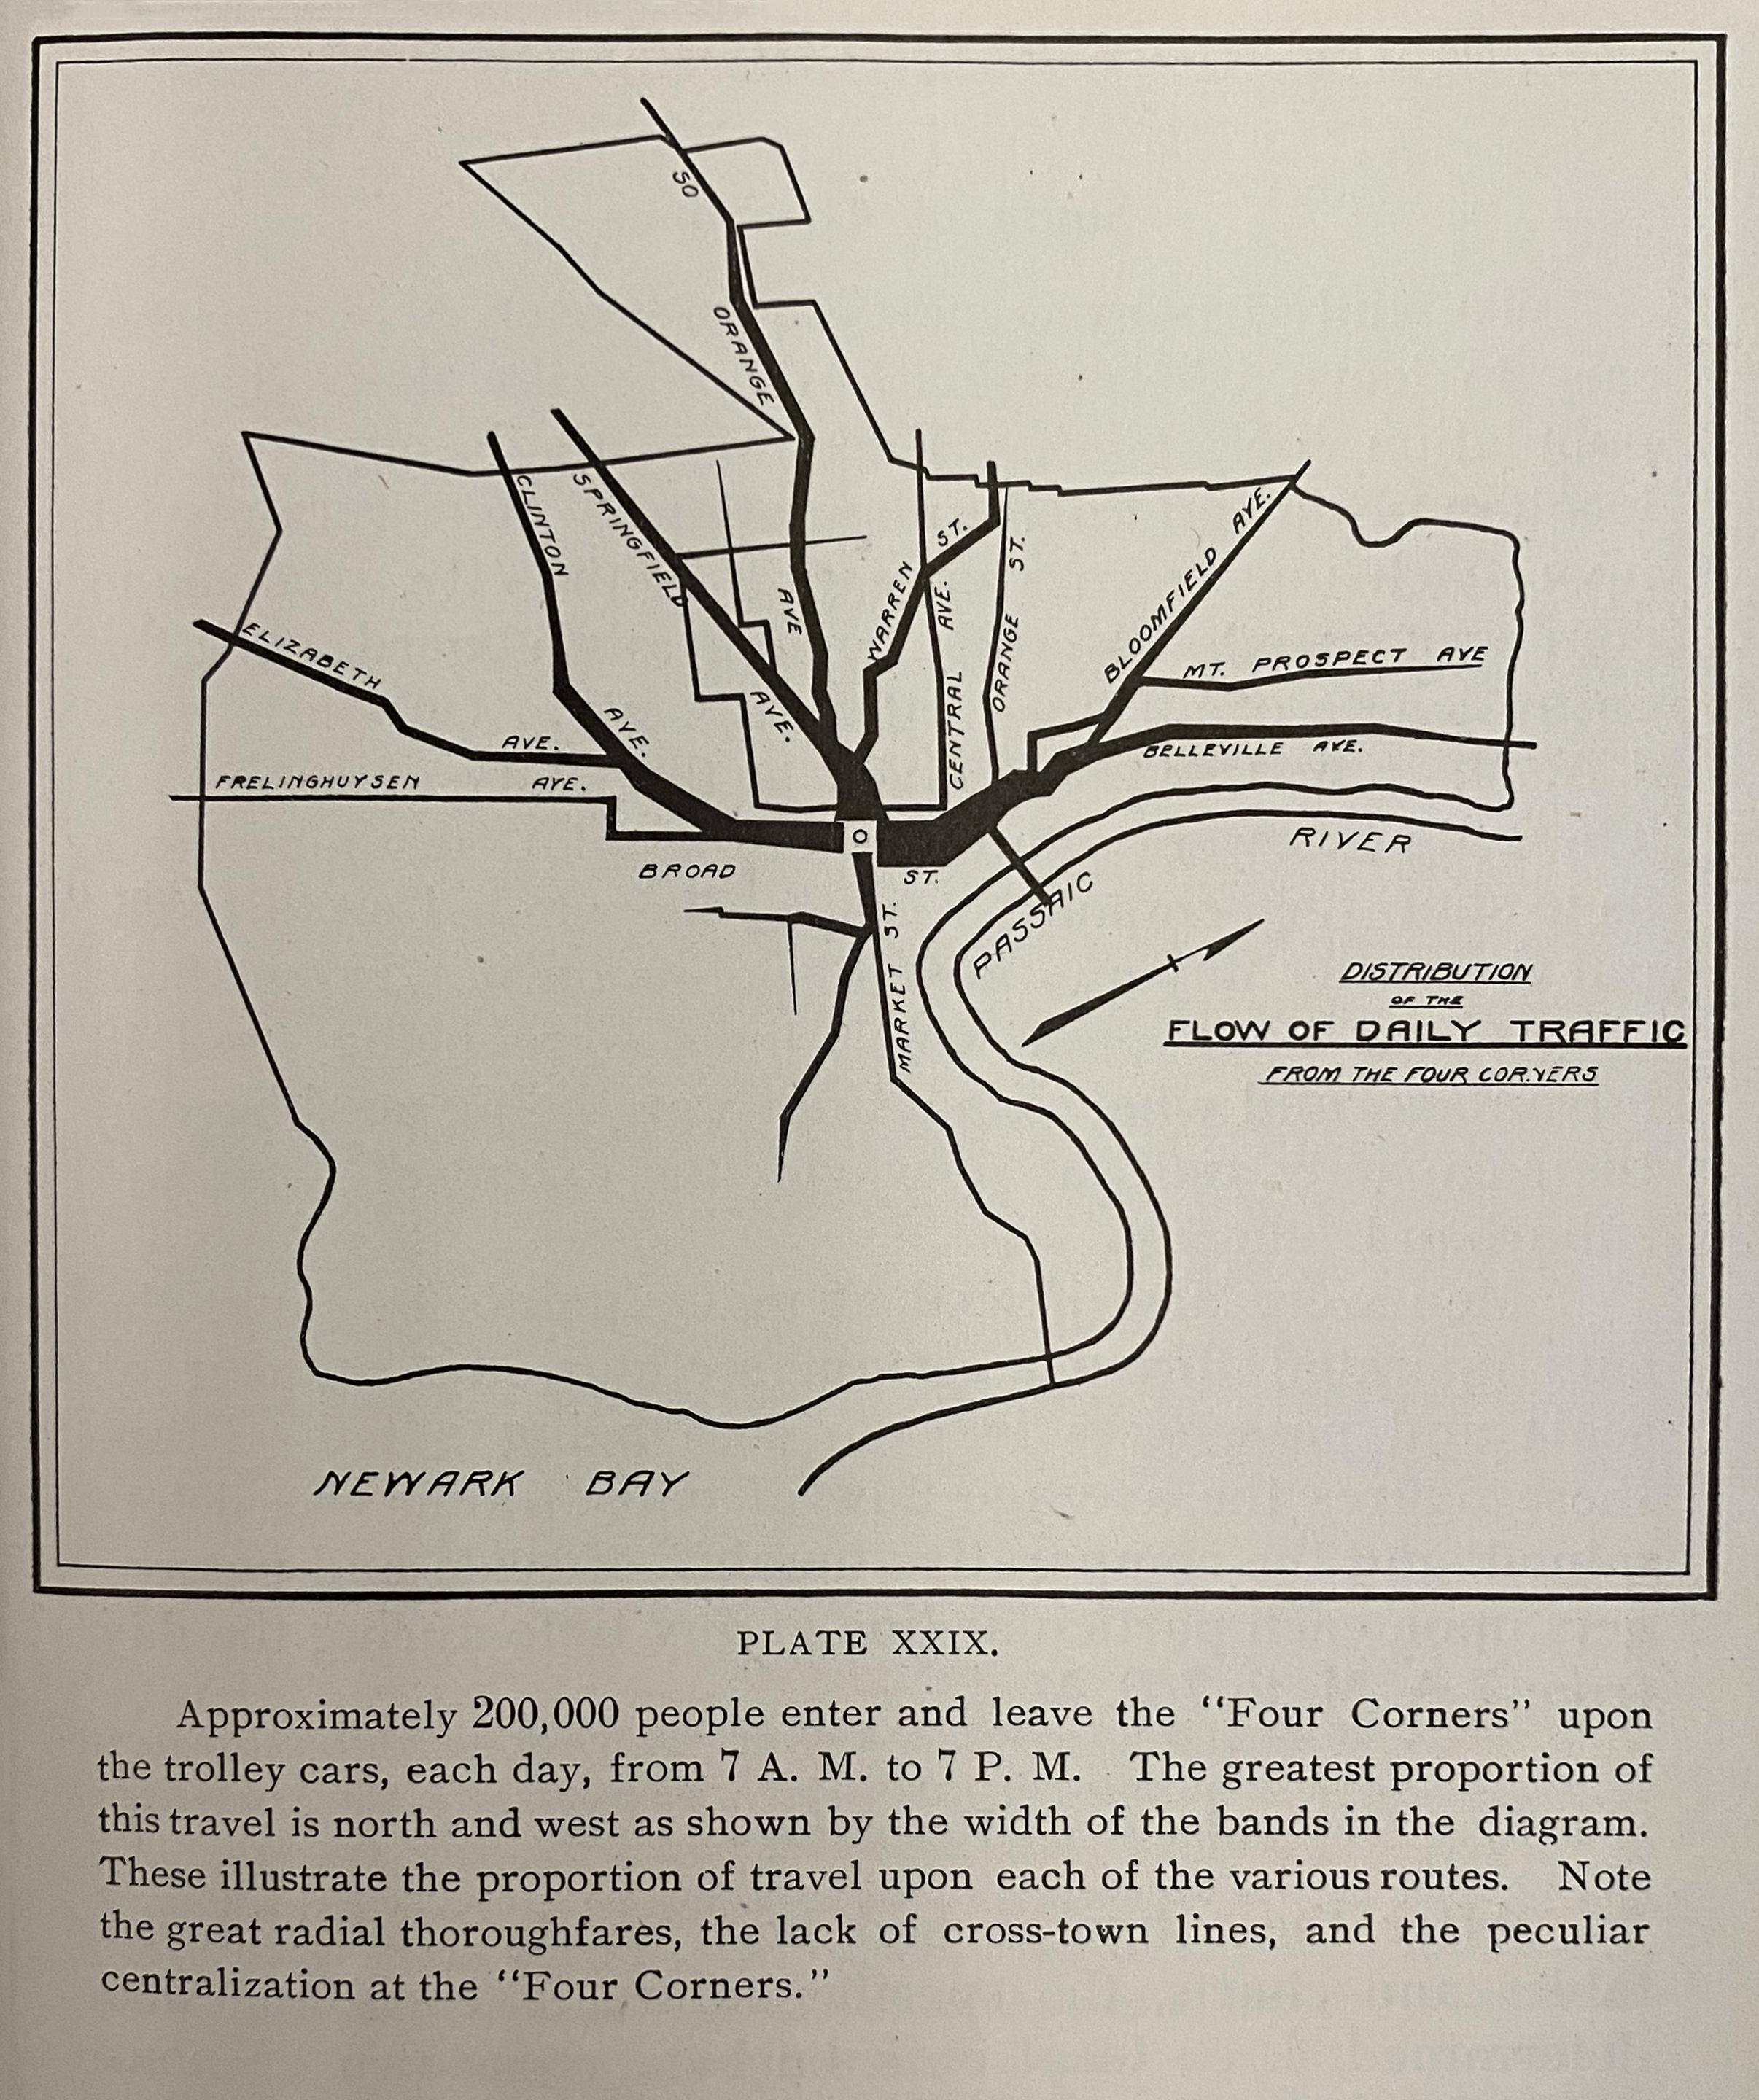
All streetcar traffic converged on Broad and Market, as shown on the map above. Stretching out from downtown like legs on a spider was the web of radial streets and streetcar tracks. Five miles from downtown Newark and ten miles from Lower Manhattan, the city came to an end wherever the streetcar lines stopped. In Newark, streetcars extended north and south on Broad Street, northwest on Bloomfield Avenue, west on Market Street, and southwest on Springfield Avenue. A few miles distant, where land was cheapest, the streetcar lines ended with their maintenance yards and storage sheds adjacent the city cemeteries. In an age before the automobile, the size of the American city was limited by the size of its commuter transport system on horse cars, trolleys, railroads, and omnibuses.
Consider this 1916 description of downtown Newark glowing with life, written by literary critic Walter Prichard Eaton on the occasion of the 250th anniversary of Newark’s founding:
The colors leap out from the women’s hats and dresses, and faces flash white. Flags high aloft and the myriad shop windows along the curb supply additional color, while in Newark especially the big orange-yellow trolley cars, moving slowly along the centre of the way, keep the color note prominent. It is this bright, animated stream of life, in ceaseless motion, now black with shadow, now flashing into color, forever pouring through the bottom of a cañon which displays the shifting lights and shades of Nature’s handiwork together with flags and glittering window-panes and gilded signs of man’s making, that constitutes the peculiar feature of American commercial cities.
All traffic and all people went through downtown. There were no highways the way there are today – like Route 21, Interstate 78, and Interstate 280 – for high-speed traffic to bypass downtown. By the time Newark’s Public Service Trolley Terminal opened at Military Park in 1916, 300 trolleys an hour passed through the adjacent intersection of Broad and Market Street. The map below from planner Harland Bartholomew illustrates that as late as 1934, up to 300 buses and trolleys each morning rush hour delivered passengers to downtown offices and department stories. Notice on the below map that the width of colored lines indicates the intensity of traffic, and that all traffic converges on downtown. Both local commuter traffic, trolleys, buses, and long-distance truck traffic shared the same roads.
Suburban sprawl and interstate highways changed all this. By 1910, one out of ten New Jersey residents lived in Newark, and about one half of all New Jersey residents lived within a 45-minute commuting distance of downtown Newark by public transit. One quarter of all jobs were in Newark, and one half of all department store purchases were in Newark. the 1940s and 1950s, all this began to change. The map below from a later master plan shows the majority of traffic bypassing downtown along the interstate highways.
At the same time suburban sprawl and White flight pulled people away from Newark. Newark’s population fell, both in real numbers and as percentage of New Jersey’s population. In 1910, 14% of all New Jersey residents lived in Newark. By 2010, only 3% of New Jersey residents lived in Newark. The table below compares population growth in Newark vs. New Jersey. While the state of New Jersey and Newark suburbs kept on growing, the population of Newark stagnated and declined.
The quality of downtown life and the quality of the urban form suffered. As downtown lost population, it evolved from a mixed-use residential, industrial, and commercial neighborhood. By the 1970s and 1980s when Gateway Center was completed, downtown had completed its transformation to become a commercial neighborhood, active during the workday but inactive and dead at night. In lock step with downtown’s loss of population, the old fabric of downtown’s homes and businesses were demolished and replaced by upwards of 300 acres of surface parking and hundreds more acres of urban renewal projects.
A city that was 97% White in 1910 had become over 50% Black by the 1960s. As Blacks grew as a percentage of Newark’s population, downtown businesses continued shifting their investments away from the Black inner city. Newark’s Prudential insurance company rebuilt its downtown offices in the 1960s but opened branch headquarters in the suburbs. Newark’s Bamberger’s department store expanded to branch locations in suburban shopping malls. Newark’s Howard Savings Bank opened branch banks, first on the highways that cut through Newark and later in the suburbs themselves. While businesses moved away, factories simply closed up shop in the 1980s onwards and moved abroad for cheaper foreign labor.
In the essay In the essay Voices of Newark, journalist Jervis Anderson described downtown in October 1967, just weeks after the July 1967 rebellion:
The stranger from Manhattan enters and leaves at downtown Newark. The impression, on leaving, is what it was on entering: sterility, a dingy collection of commercial buildings with a stunted air over them, spreading away in a monotonously flat expanse. Nowhere is there to be seen that leap skyward that nourishes and releases the imagination. The Cultural Center on Broad Street, probably the place where the fashionable used to repair for a leisurely musical evening, now stands in jaded baroque among a row of modest storefronts, looking like an early affluent mistake. There are many Negro faces mixed in the crowds downtown, but they all seem like visitors’ faces, wearing a look of connection to some other turf. A cop roars off from a traffic intersection on a powerful motorbike; his eyes are hidden behind broad, metal-rimmed dark glasses, and his blue shortsleeves are rolled up above his biceps. He leaves behind a fleeting hint of what one has heard and read of Southern small-town terror.
Nor does it help that one’s first look at the city comes on a hot midsummer’s day: in this stifling and oppressive embrace, one imagines that Newark could easily be a place where nothing grows, where tender shoots sprout and then wilt. It makes one wonder a little about what will become of all the tender black dreams, both those that are radically new and those old ones that keep sprouting over and over again through the dead ground.
As you view these photos of downtown, reflect on how the city has changed over time and how the visually unpleasant parts of Downtown were not always this way. Consider: What kinds of buildings and living spaces could bring back people to live downtown, within walking distance of the places they work? What kinds of government policies could reverse the suburban sprawl and bring back business investment to Downtown? The history of where Downtown was in 1910 must be the inspiration for how the Downtown will be rebuilt. The city must be rebuilt not with skyscrapers and superblocks but with the kinds of human scale and walkable streets of multi-use small buildings that the city once had.
Of the approximately 40,000 people living in Belmont in 1960, over 90% were Black. Most survived on annual incomes less than $3,000 ($30,000 inflation adjusted) per year in comparison to a nationwide average of $5,600 per year ($56,000 inflation adjusted). Over 90% of residents were renters, and few of them were homeowners. Its poverty, its high Black population, and the longer history of denying investment and loans to people living here made this neighborhood particularly vulnerable.
This neighborhood was the most affected and almost entirely erased by urban renewal for public housing projects and the campus of UMDNJ. In the period 1950 to 1990, over 95% of all homes and buildings in Belmont were demolished. In the resulting photo comparisons, almost nothing survives of the communities that once were: dozens of Baptist churches, hundreds of corner stores, and thousands of largely Jewish-owned small businesses.
For most of its history, Newark was a majority-White city, where Blacks represented no more than 10% of the population. Upwards of 30% of Newark’s population was foreign born in the early 20th century, 40% worked in manufacturing, and most were immigrants from Europe. Belmont’s flat land for development, thousands of tenements, and proximity to factories downtown made it ideal for immigrant enclaves of Jews, Italians, Germans, and Poles.
By the 1950s, two major shifts were happening in Belmont, as well as dozens of other old immigrant neighborhoods in northeastern American cities. As Newark immigrants and their children found better paying jobs and integrated into American society, they moved out of crowded Belmont and into more comfortable and mass-produced homes in the low-density suburbs. These new suburban communities were for Whites only, if not by law then by practice. In the 1959 novel Goodbye Columbus, Newark-born author Philip Roth described the journey by car up Springfield Avenue. The drive from working-class Belmont to the upper-class suburb of Short Hills was a journey toward heaven for him:
Once I’d driven out of Newark, past Irvington and the packed-in tangle of railroad crossings, switchmen shacks, lumberyards, Dairy Queens, and used-car lots, the night grew cooler. It was, in fact, as though the hundred and eighty feet that the suburbs rose in altitude above Newark brought one closer to heaven, for the sun itself became bigger, lower, and rounder, and soon I was driving past long lawns which seemed to be twirling water on themselves, and past houses where no one sat on stoops, where lights were on but no windows open, for those inside, refusing to share the very texture of life with those of us outside.
The second major shift was the Great Migration. At least six million Blacks fled from poverty, unemployment, and racial tensions in the south to northern cities they hoped would be better. As internal immigrants within America and as a people at the bottom of the class system, these Blacks settled in the same Newark neighborhoods as earlier generations of White immigrants. Many of Belmont’s Jewish synagogues and Catholic churches were soon sold off and given new life as Black Baptist congregations. But, unlike earlier generations of White immigrants who used Belmont as a stepping-stone to climb the social ladder, Blacks in Newark were locked out of home financing and were only given low-paying manual labor jobs with few chances for promotion.
At the same time, urban renewal projects were eating away at Belmont’s Black homes. This was ground zero for slum clearance and for the violence that resulted. In the name of slum clearance, all of this area was swept clean from map, along with the histories these buildings contained of multi-generational and multi-racial immigrant struggle. Residents had little choice but to move yet again or to stand their ground and resist, as thousands did in the July 1967 rebellion. Newark’s civil unrest started in and was centered on Belmont and its main street of Springfield Avenue.
Samuel Berg’s collection shows Belmont at a historical turning point in the years 1958 to 1962. The Great Migration of Blacks to northern cities was slowing down, while urban renewal projects were picking up pace. These photos document almost every home, building, and business in Belmont near its height as a Black community. Notice in these photos the multi-story tenements and corner stores, for which there is no longer the population or the foot traffic to sustain. The walkable and human-scale fabric of the old city that required generations to organically develop was lost forever, replaced by vacant land, parking lots, strip malls, and endless rows of low-cost prefabricated housing.
In the two maps below, Belmont is the Black neighborhood at center. Compare the extent of Black population growth and neighborhoods in 1970 vs. 2020.
Jane Davis writes:
”The beautiful Weequahic section I lived in was murdered by politicians and the real estate industry as their answer to the Black migration. (My parents came to Newark from Georgia in the late 1940s.) My family’s home — 141 Watson Ave. — was the last house torn down on that street to make way for the highway. Such a travesty. [….] It’s amazing how the Newark that was — and thus how/why it was dismantled — nowadays is unknown to… most people. And Blacks often get blamed for driving the city into the ground–for the historically ignorant, the myth/slander/libel of ‘there goes the neighborhood’ really took hold. In any case, Newark still means so much to me and is most certainly my ‘home.’
”In any case, I just wanted to say that the part of the website that has ‘before and after’ photos showing what had been in contrast to the emptiness of the highway is SO amazingly meaningful and essential — at last, I can SEE the houses, stores, etc., that made up my home but that have been erased for decades now. So, though there is much more to say about Newark, I just want to say a huge thank you from the bottom of my heart.”
All photos were manually referenced to their contemporary locations. Contemporary street views correspond to camera angles of former photos, even though address naming conventions and house numbers may have changed.
If a photo is misplaced, contact mylesz@umich.edu with a link to the photo and description of the error.